

Spectral Features
Cut-On and Cut-Off Wavelength
Cut-on wavelength describes an optical filter edge transition where transmission increases sharply over an increasing wavelength range, such as seen with a longpass filter. Conversely, cut-off wavelength describes an edge transition that decreases over a wavelength range, as seen with a shortpass filter. They are defined as the point on each respective edge where transmission reaches 50% of the peak (Figure 1), and are also known as 50% edge points and half-power wavelengths.
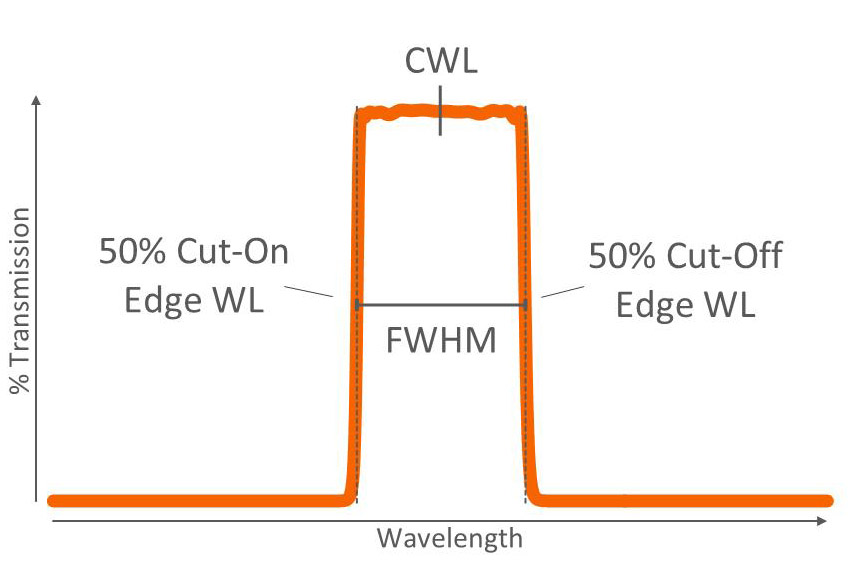
Figure 1: Cut-on and cut-off wavelengths, center wavelength (CWL), and full-width at half-maximum (FWHM) for a bandpass filter.
Like center wavelength and full width half maximum below, cut-on and cut-off wavelengths can either be specified as nominal or with a ± wavelength tolerance.
In the case of dichroic filters specified using average polarization, it is common to evaluate cut-on and cut-off wavelengths using the average of the wavelengths corresponding to 80% and 20% of peak transmittance. This is because the hitch that arises due to polarization splitting is generally seen around the 50% edge point.
Center Wavelength (CWL)
Center wavelength (CWL) can be used to describe either the center of a passband (Figure 1) or the center of a notch (Figure 2). It is defined as the midpoint, or average, between two adjacent cut-on and cut-off wavelengths.
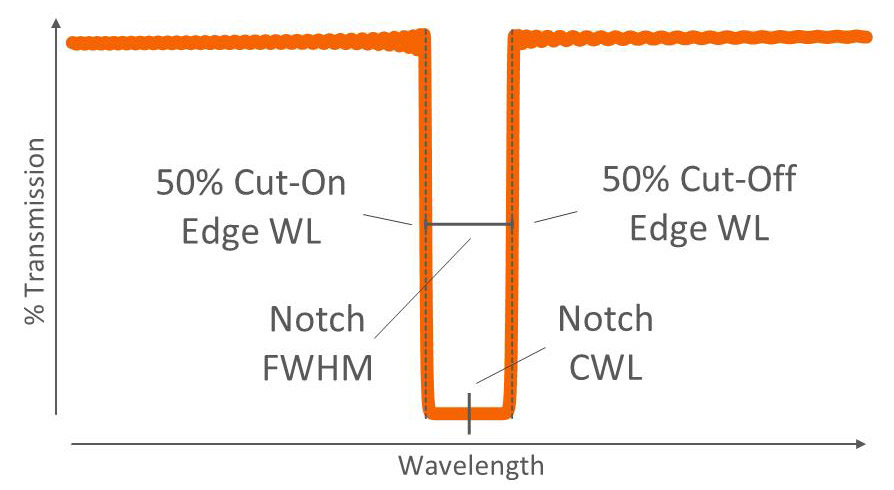
Figure 2: Cut-on and cut-off wavelengths, notch center wavelength (CWL), and notch full-width at half-maximum (FWHM) for a notch filter.
Full-Width at Half-Maximum (FWHM) and Bandwidth
Full-width at half-maximum is the distance between two adjacent 50% edge points and is also known as the 50% bandwidth of bandpass (Figure 1) or notch (Figure 2) filters.
Bandwidth is a more general term that is not limited to the point where transmission is 50% of peak and can be specified in terms of either absolute or percent of peak transmission. For example, common specifications are bandwidth at 80% of peak \(T\), or 10% absolute bandwidth.
Transmission, Reflection, and Blocking Bands
Transmission, reflection, and blocking bands are spectral regions where each respective property is required to be above, below, or within a certain level. Typically, 0° AOI optical filters such as longpass or shortpass edge filters, bandpass filters, and notch filters are specified with transmission in terms of percent and blocking in units of optical density (\(OD\)).
$$ { OD = -log_{10} (T)} $$
Where:
- \(OD\) = optical density
- \(T\) = transmission (0 ≤ \(T\) ≤ 1)
Blocking is a general term that refers to wavelength-specific beam attenuation by means of reflectance, absorbance, or both. For most 0° AOI filters, the attenuated beam is not directed to another path in the system so specifying reflectance is not necessary. However, the majority of optical filters and coatings used at larger angles of incidence, such as dichroic filters and high-reflectivity (HR) mirrors, are designed to split or reflect the beam within the system, so these are necessarily specified with reflection bands instead of blocking.
When specifying transmission, blocking, and reflection bands, it is important to indicate whether the specification is absolute or average. An average transmission band specification, for example, means that the average transmission values over the specified wavelength range must meet the specified tolerance (e.g. \(T_{avg} > 95\%\)). An absolute transmission spec, on the other hand, means that all transmission values in the specified range must meet the tolerance value (e.g. \(T_{abs} > 95\%\)).
Absolute specifications are mandated by some systems and applications but they can lead to increased cost or decreased design feasibility if the transitions between transmission and blocking/reflection bands are tight. In order to maintain design feasibility, edge transitions, AOI range, CHA, and manufacturing tolerance should also be taken into account when determining transmission, blocking, and reflection ranges.
Ripple
Ripple designates the allowable amount of theoretical and measured variation within a transmission or reflection band, usually called out as peak-to-valley (e.g. \(T_{ripple} < 5\%\) P-V).
Optical filters that exhibit a moderate or large amount of transmission or reflection ripple can decrease the performance of some systems. As an example, an emission filter with moderate passband ripple in a fluorescence imaging system will result in decreased image contrast. For that reason, it is up to the optical filter manufacturer to design filters with low passband ripple and maintain precision control during the coating process so that minimal ripple is introduced. This is considered good practice even when ripple is not expressly specified.
Edge Steepness
Edge steepness refers to the sharpness of the transition between a transmission band and an adjacent blocking or reflection band. It can either be specified as a distance (e.g. \(λ_{90\%T}\) to \(λ_{OD2}\) < 5 nm) or as a percentage (e.g. \(λ_{50\%T}\) to \(λ_{OD4}\) < 1% of edge WL, calculated as: \( 100*\frac{|λ_{50\%T}-λ_{OD4}|}{λ_{50\%T}} \) ).
Calling out edge steepness is useful when this specification is used in conjunction with average transmission and blocking/reflection bands. However, it is generally not necessary when transitions between adjacent bands are tight or when both bands are specified as absolute. In these cases, the filter steepness is already dictated by the transmission and blocking/reflection specifications.
Measuring Optical Filter Spectra
Most optical filter spectra are measured using a spectrophotometer or other grating-based measurement system. These systems are able to measure optical filter transmittance using a broadband light source in conjunction with monochromators that are composed of a diffraction grating and a series of slits and mirrors (Figure 3).
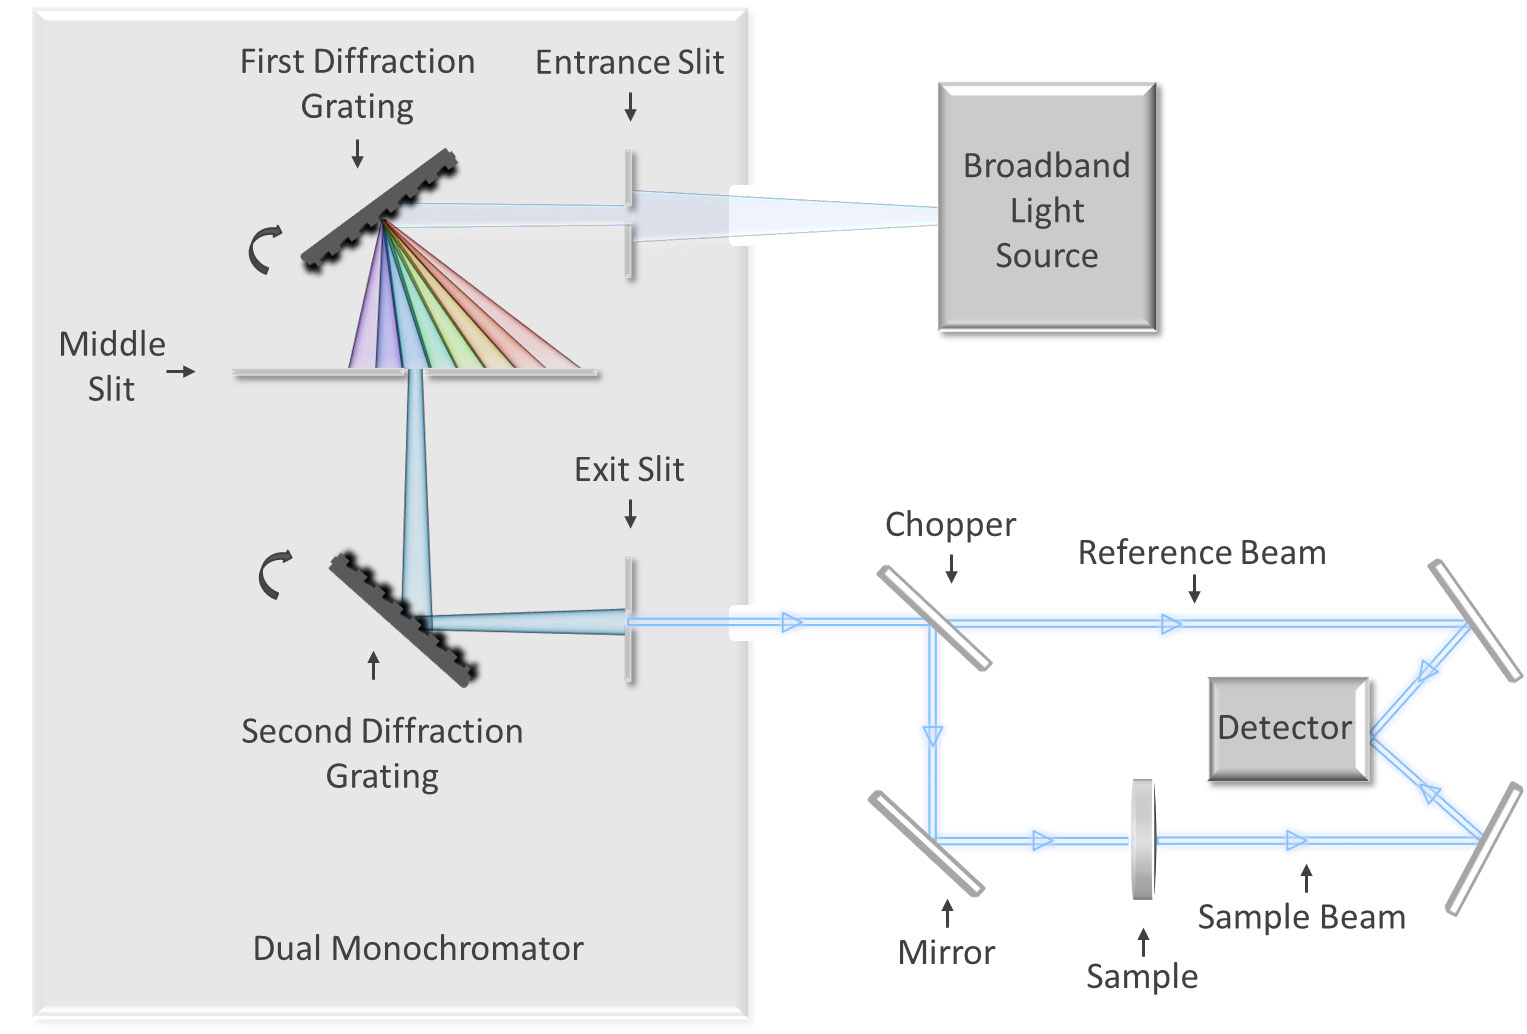
As broadband light strikes the first diffraction grating, it is dispersed into its component wavelengths, with each reflecting off of the grating at a slightly different angle. By rotating the grating, the monochromator is able to sequentially project each wavelength, or band of wavelengths, through a slit. The beam then travels to a second monochromator or grating in order to reduce the stray light in the system before it finally exits through another adjustable slit that further narrows the spectral bandwidth (SBW). By adjusting the slit-width, both light intensity and spectral resolution are able to be controlled.
Achieving high spectral resolution is imperative because many optical filters are designed with steep transitions from high transmission to deep blocking over a short wavelength range. If the spectral resolution is relatively coarse, the measurement will yield a smeared and rounded edge that is not representative of the true steepness of the filter.
This effect is further compounded for optical filters with sub-nanometer bandwidths. Whenever the bandwidth is close in value to the spectral resolution of the instrument, the scan will exhibit an unresolved passband with a rounded peak and relatively low transmission.
In general, there are three different measurement methods used to measure optical filters using a standard spectrophotometer, each used to evaluate different spectral features. In many cases, all three are required for pass/fail disposition:
Method # 1: A narrow scan is commonly used to evaluate filters with steep edges, tight tolerances, and narrow passbands. This method incorporates the following three techniques:
- The exit slit is narrowed, thereby reducing the spectral bandwidth (SBW) of the incident light and improving spectral resolution
- One or more small apertures are introduced into the beam to reduce the spot size and cone angle of the incident light, further reducing edge smearing
- The wavelength range is focused on the feature of interest and the smallest possible step size is used
However, since light intensity is reduced by both decreasing the slit-width and introducing apertures, the signal-to-noise ratio is also decreased, which ultimately results in a noise floor that is raised by several orders of magnitude. Therefore, this method is useful for resolving marginally steep optical filter edges to a level of approximately OD2 or OD3, but cannot be used to evaluate attenuation beyond that level (Figures 4a and 4b).
Method #2: A blocking scan can be used to evaluate blocking up to a level of OD6 or OD7. The following techniques are used to perform the scan:
- The exit slit is widened and all apertures are removed in order to increase light intensity and lower the noise floor
- A technique known as Rear Beam Attenuation (RBA) is used to further lower the noise floor by biasing the dynamic range of the detector, thus increasing the signal-to-noise ratio
- The full wavelength range is evaluated and a coarse step size is used
Performing this method presents a trade-off because the increased light intensity is achieved by increasing the SBW, which results in coarse spectral resolution. Therefore, even for standard-performance optical filters, a blocking scan will show distorted edges and inaccurate bandwidths (Figures 4a and 4b).
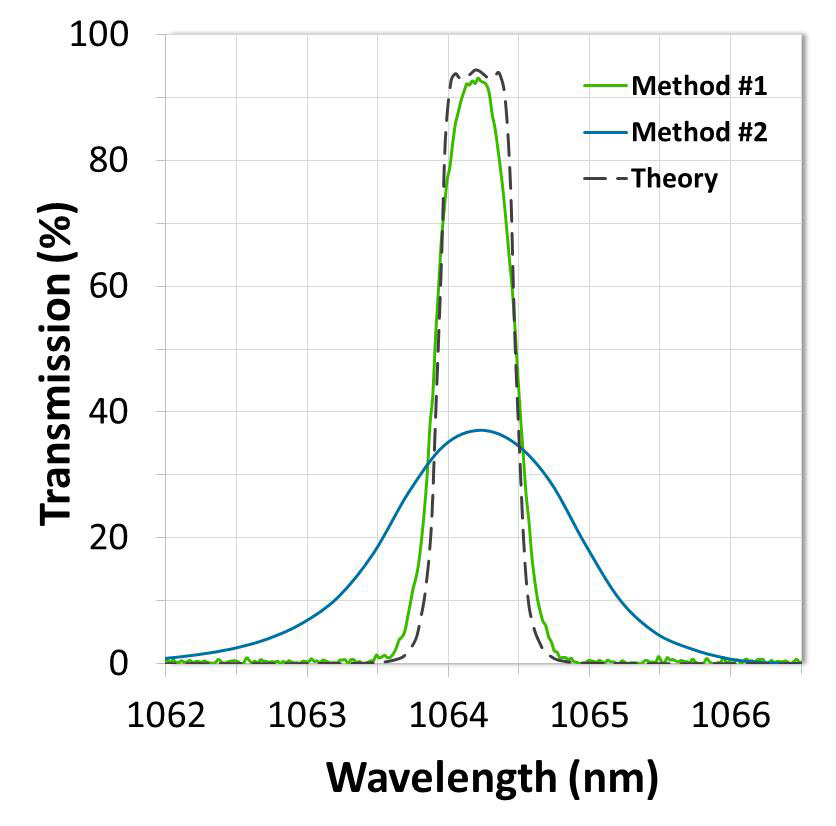
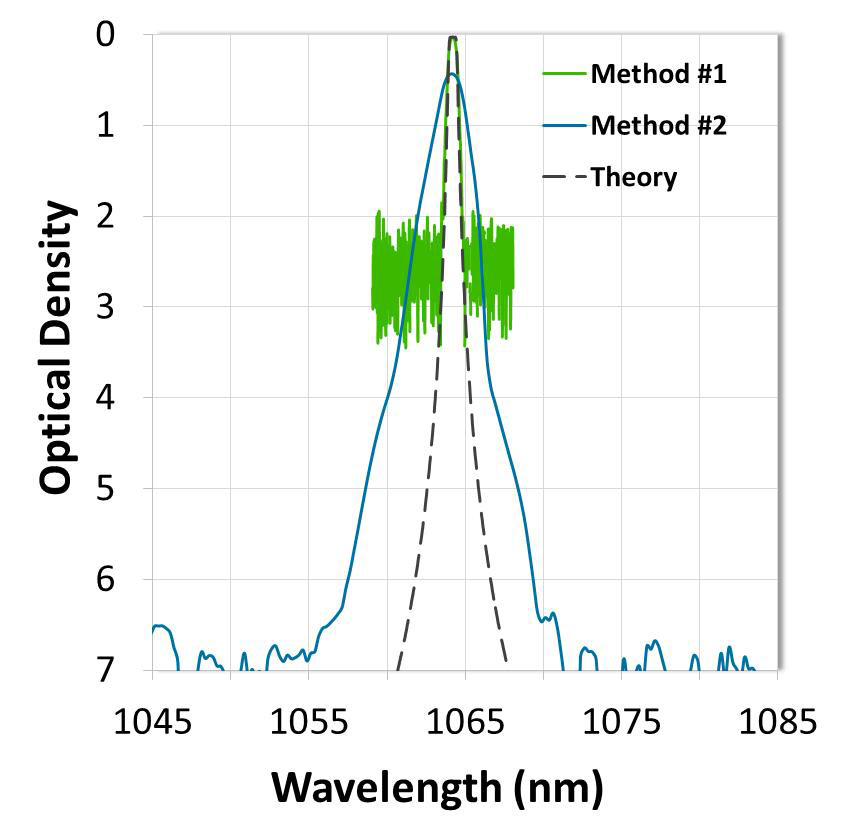
Figures 4a & 4b: Comparison of optical filter measurements performed using method 1 vs. method 2. Scan data are shown in (a) transmission and (b) optical density.
Method #3: A wide scan can be used independently to evaluate standard-performance optical filters, or in conjunction with the other two scan methods to disposition higher-performance filters. This method is performed by simply using a moderate SBW setting and step size, which produces a scan with a noise floor of ~OD4.
Spectrophotometer measurements obtained using the above three methods are still limited when it comes to evaluating optical filters with exceptionally steep edges, blocking beyond ~OD6, or passbands narrower than ~0.5 nm. For these filters, corresponding specifications are commonly evaluated either as “by design” or through an extrapolative analysis. However, other instruments such as tunable lasers and Alluxa’s custom-built HELIX Spectral Analysis System are able to measure the highest-performance optical filters.
Note: Although reflectance can be directly measured, transmittance scans are commonly used to evaluate reflection specifications using the \(R≈1-T\) approximation for many optical filters and coatings in the visible and NIR range where absorbance is negligible.
Anti-Reflective (AR) Coating
Anti-reflective (AR) coatings are designed with high transmittance and low reflectance over a specified wavelength range dictated by system requirements. They are coated on a variety of optical components with the combined goals of increasing transmission and eliminating the appearance of ghost images caused by any backward-reflected light in the system. One or more surfaces of an optic can be coated with an AR.
In the case of optical interference filters designed with the main coating on a single surface, such as notch, longpass, shortpass, dichroic, and some bandpass filters, AR coatings are necessarily applied to the second surface of the substrate to minimize transmission loss caused by Fresnel reflection.
For many other bandpass filters, multiband filters, and thick optical coatings, the coating designer will necessarily split the coating between both surfaces in order to mitigate the effect of coating stress. In these instances, the second side coating is always designed with regions of high transmittance and low reflectance that correspond to the specified transmission bands, thereby minimizing Fresnel reflection and effectively acting as an AR coating. However, a second side AR coating is still necessary whenever system requirements dictate a very low second-side AR reflectance value.
Why Alluxa?
Alluxa’s team of experts has delivered key innovations to the field of optical thin-films. In addition to designing and constructing all of our own custom optical thin-film coating equipment, we invented a novel plasma deposition coating process that both increases the performance of our optical filters and decreases the time it takes to produce them.
By combining these innovations with state-of-the-art automation, proprietary control algorithms, and precision monitoring during the coating process, we are able to deliver low-cost, high-performance, custom thin-film optical filters for any application.
